Documentation
Reports
Reports
Reports
Use the Reports page to generate summary reports of the traffic, alerts and detector activity monitored by NETALERT, and to retrieve reports generated earlier. Open it from Reports in the Management group of the left-side menu, or from Administration > Advanced Features > Reports.

The page has three parts:
- A header with the number of generated reports and the time of the newest one, plus the Generate Report… and Reports Config buttons.
- Choose a report, a gallery of the available report types. Click a card (Create report) to open the generate form with that type already selected.
- Recent reports, the library of reports already produced.
Every run produces two files with the same content: a PDF and an HTML copy. There is no format to choose when generating; you pick the format when you download.
Report types
NETALERT offers seven report types. Select the report that matches the question being asked rather than the broadest one: a narrower report over the same period is faster to produce and easier to act on.
| Executive Summary | KPIs, top alerts, MITRE ATT&CK and ML health at a glance |
| Alert & APT Activity | Alert trends, severity, MITRE ATT&CK and APT scenarios |
| Top Talkers | Highest-volume IPs, applications and protocols. Supports a ranking depth and a scope filter (see below) |
| ML Detector Health | Per-detector predictions, alert rate, training and drift. This is a snapshot of the current state of the ML detectors, so it takes no time window |
| IOC / Threat Intel | IP and domain indicator inventory, plus traffic tag volumes. Only part of this report follows the time window; the indicator tables are always complete |
| Device Risk | Highest-risk endpoints ranked by alert activity |
| Daily Statistics | Classic per-section traffic and alert tables. This is also the report that scheduled runs produce, and its sections follow the Reports Config settings |
Generating a report
Click Generate Report… in the header, or a card in Choose a report, to open the Generate a Report form.
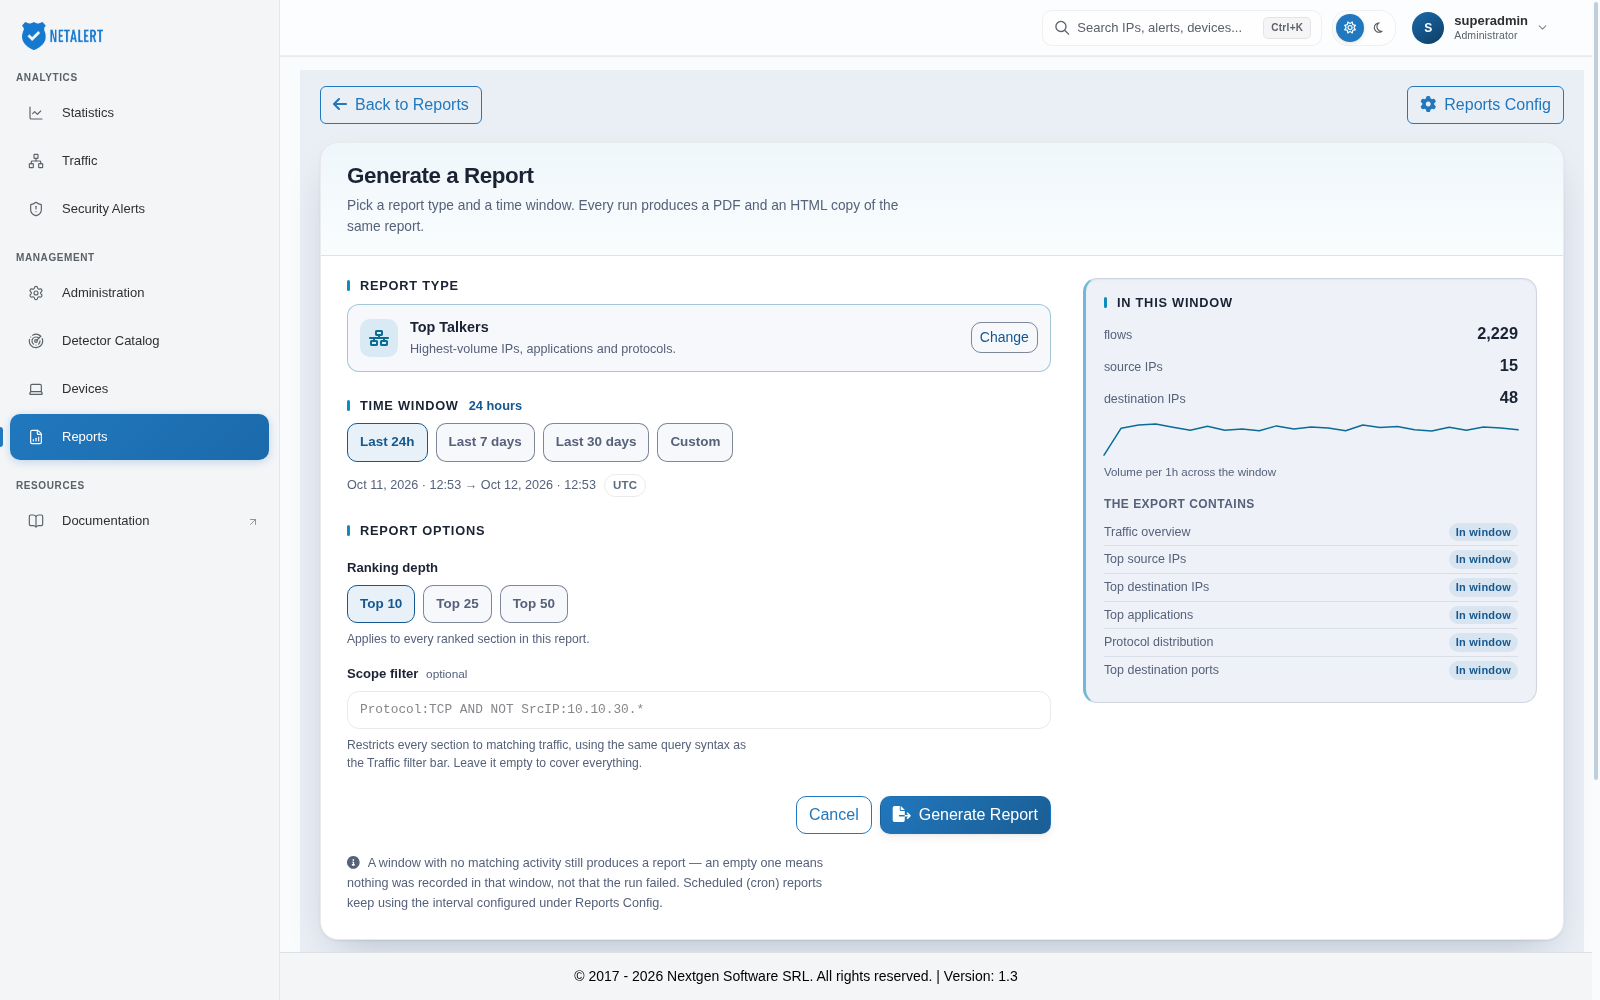
- Report type - shows the selected type. Click Change to pick a different one.
- Time window - choose Last 24h, Last 7 days, Last 30 days or Custom. With Custom, enter the start and end in the date fields. The length of the window is shown next to the heading, and the dates beneath the presets show the exact period covered, in UTC. A window longer than 90 days produces a warning, because generation time grows with the window. A window that ends before it starts, or starts and ends at the same moment, is rejected.
- Report options - only shown for report types that use them. For Top Talkers:
- Ranking depth - Top 10, Top 25 or Top 50. Applies to every ranked section in the report.
- Scope filter (optional) - restricts every section to matching traffic, using the same
query syntax as the Traffic filter bar, for example
Protocol:TCP AND NOT SrcIP:10.10.30.*. Leave it empty to cover everything.
- Click Generate Report.
While you set up the report, the panel on the right previews what it will contain. For windowed reports, In this window shows the main counts for the selected period with a volume sparkline, and The export contains lists the report’s sections, each tagged In window (follows the time window), All time (full table, ignores the window), Mixed or Snapshot (current state at generation time). The IOC / Threat Intel preview also shows an Indicator inventory with the number of indicators in each list. A count marked Needs permission requires the Modify settings permission to read; Unavailable means the count could not be retrieved.
For ML Detector Health, the Scope section explains that no time window applies, and the preview shows the Fleet state: each ML detector with its training result, PSI (Population Stability Index, a measure of how far live traffic has moved from the training data), number of predictions and alert rate. Detectors that need attention are listed first. A PSI of 0.25 or above is past the drift threshold; 0.10 or above is approaching it.
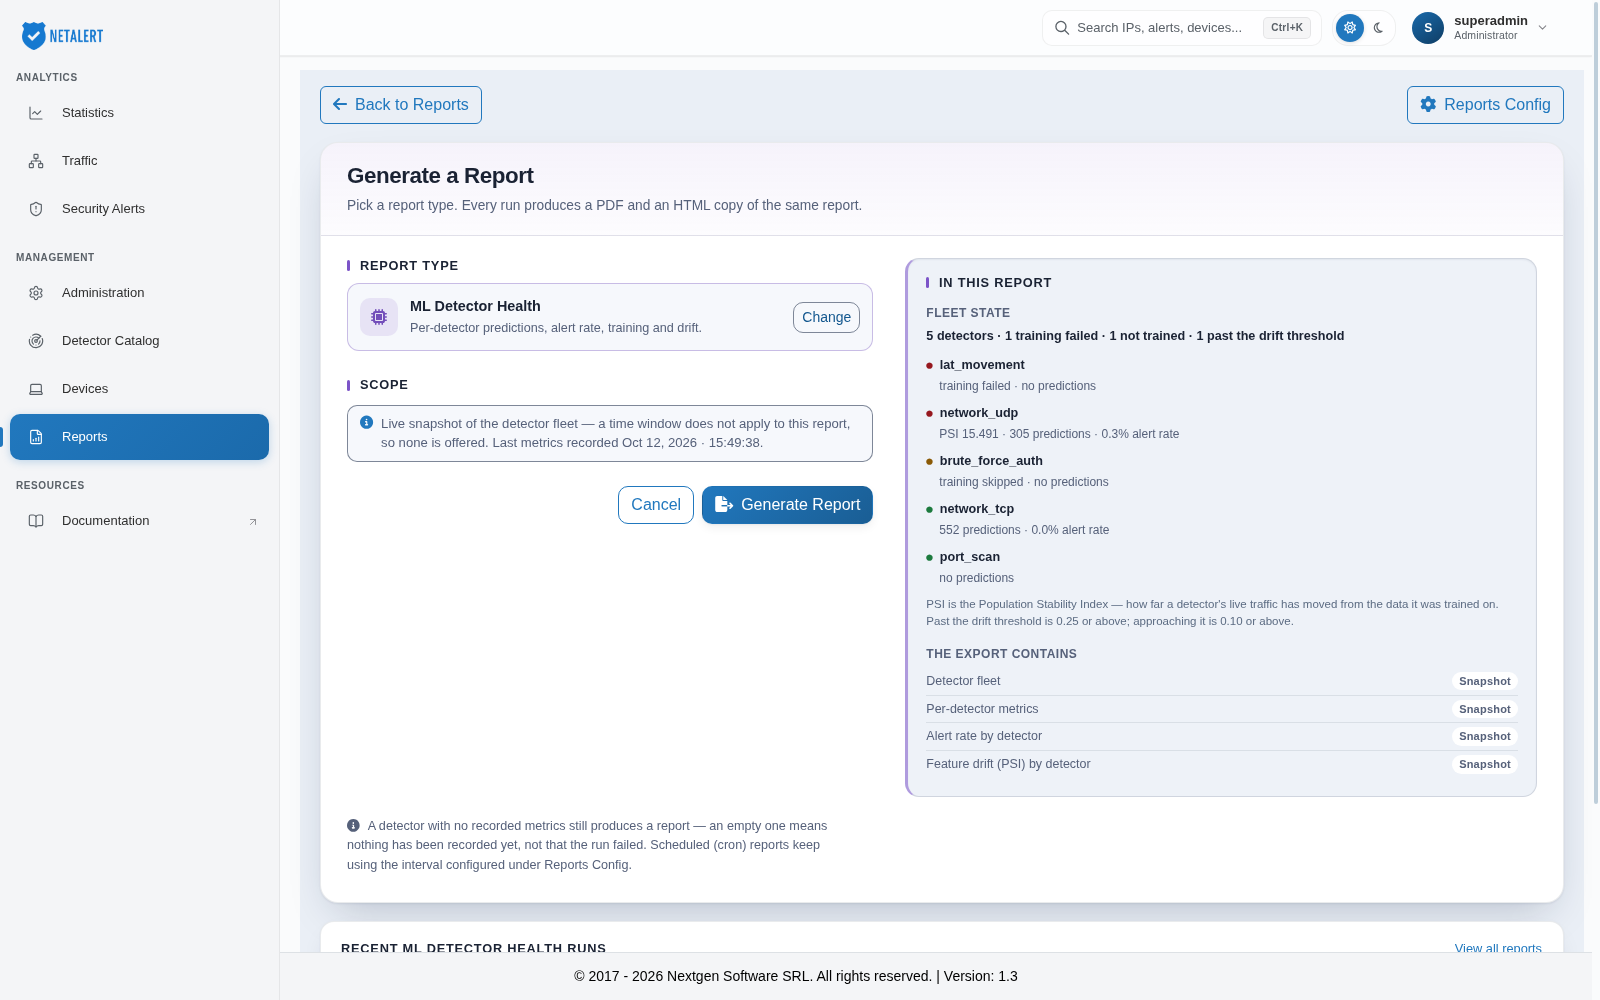
While the report is being built, the button reads Generating… and a progress line shows the elapsed time. Click Stop waiting to leave the form; the server may still finish the report, and it then appears in Recent reports. If the server does not respond in time, which usually means the time window is too large for one request, the form keeps your selection so you can try again or narrow the window.
When the report is ready, the form shows Download PDF, Download HTML and View in library, and the button changes to Generate again. Below the form, Recent type runs lists earlier reports of the same type, with download buttons, and View all reports returns to the library.
A period with no matching activity still produces a report. An empty report means that nothing was recorded in the window, not that the run failed.
Click Back to Reports to return to the main page.
Recent reports
The Recent reports library lists every generated report, newest first.
- Search by type, file name, or date… - filters the list as you type, for example by a date such as “Sep 8”.
- All types - restricts the list to one report type. Each entry shows how many reports of that type exist.
- Click the Type, File or Generated (appliance time) column header to sort by that column. Generation times are shown in the appliance’s local time.
- Use Rows per page and the page buttons in the bar beneath the table to move through the list.
Each row has four actions:
- Run again - opens the generate form with the same report type selected.
- HTML and PDF - download the report in that format.
- Delete - removes the report, after confirmation.
Delete all reports removes every report in the library, after confirmation.
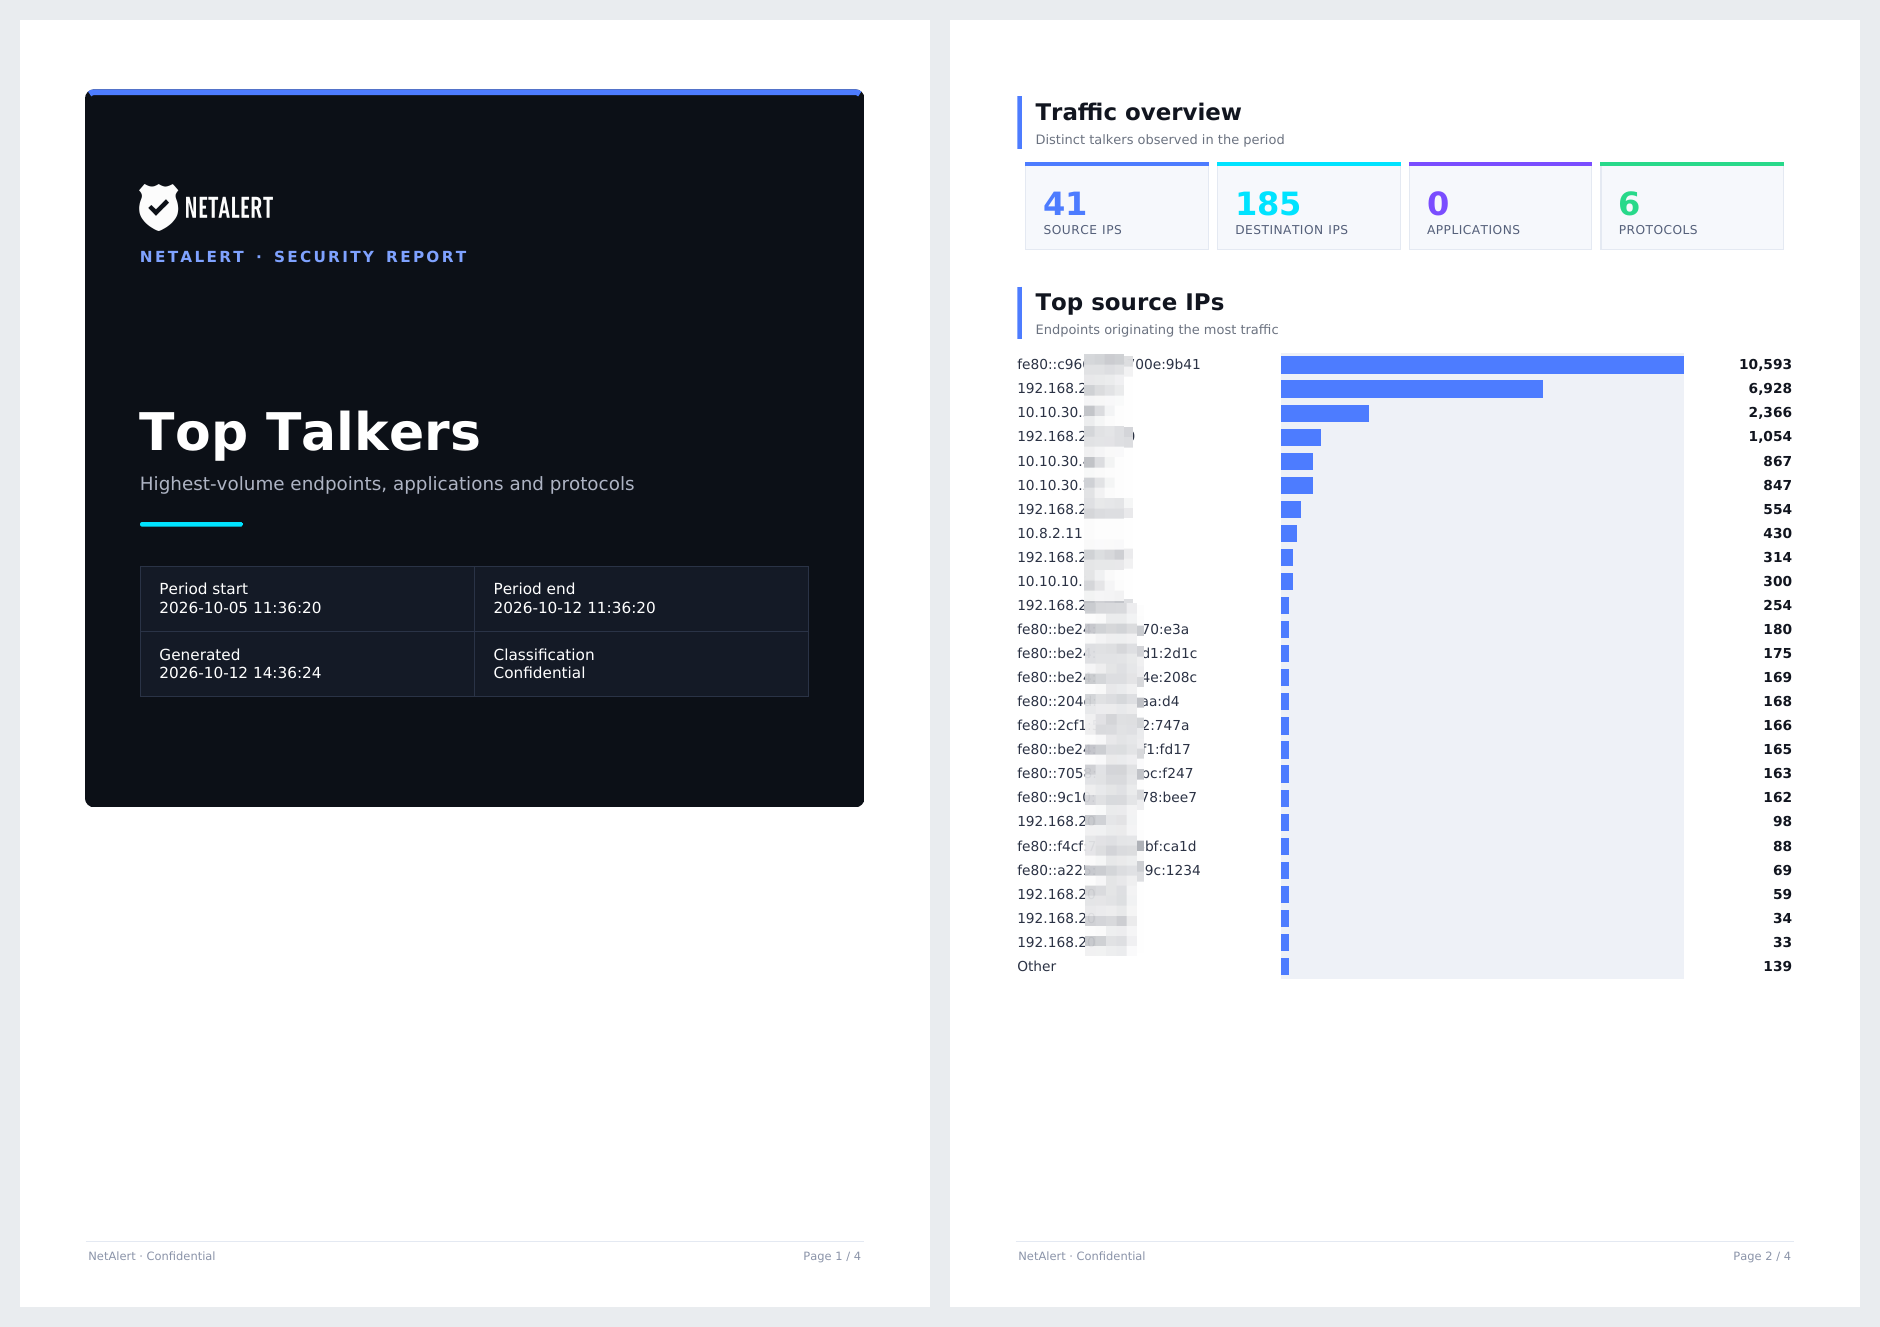
The PDF report opens with a cover page giving the report title, the period covered, the generation time and the classification, followed by one section per topic:
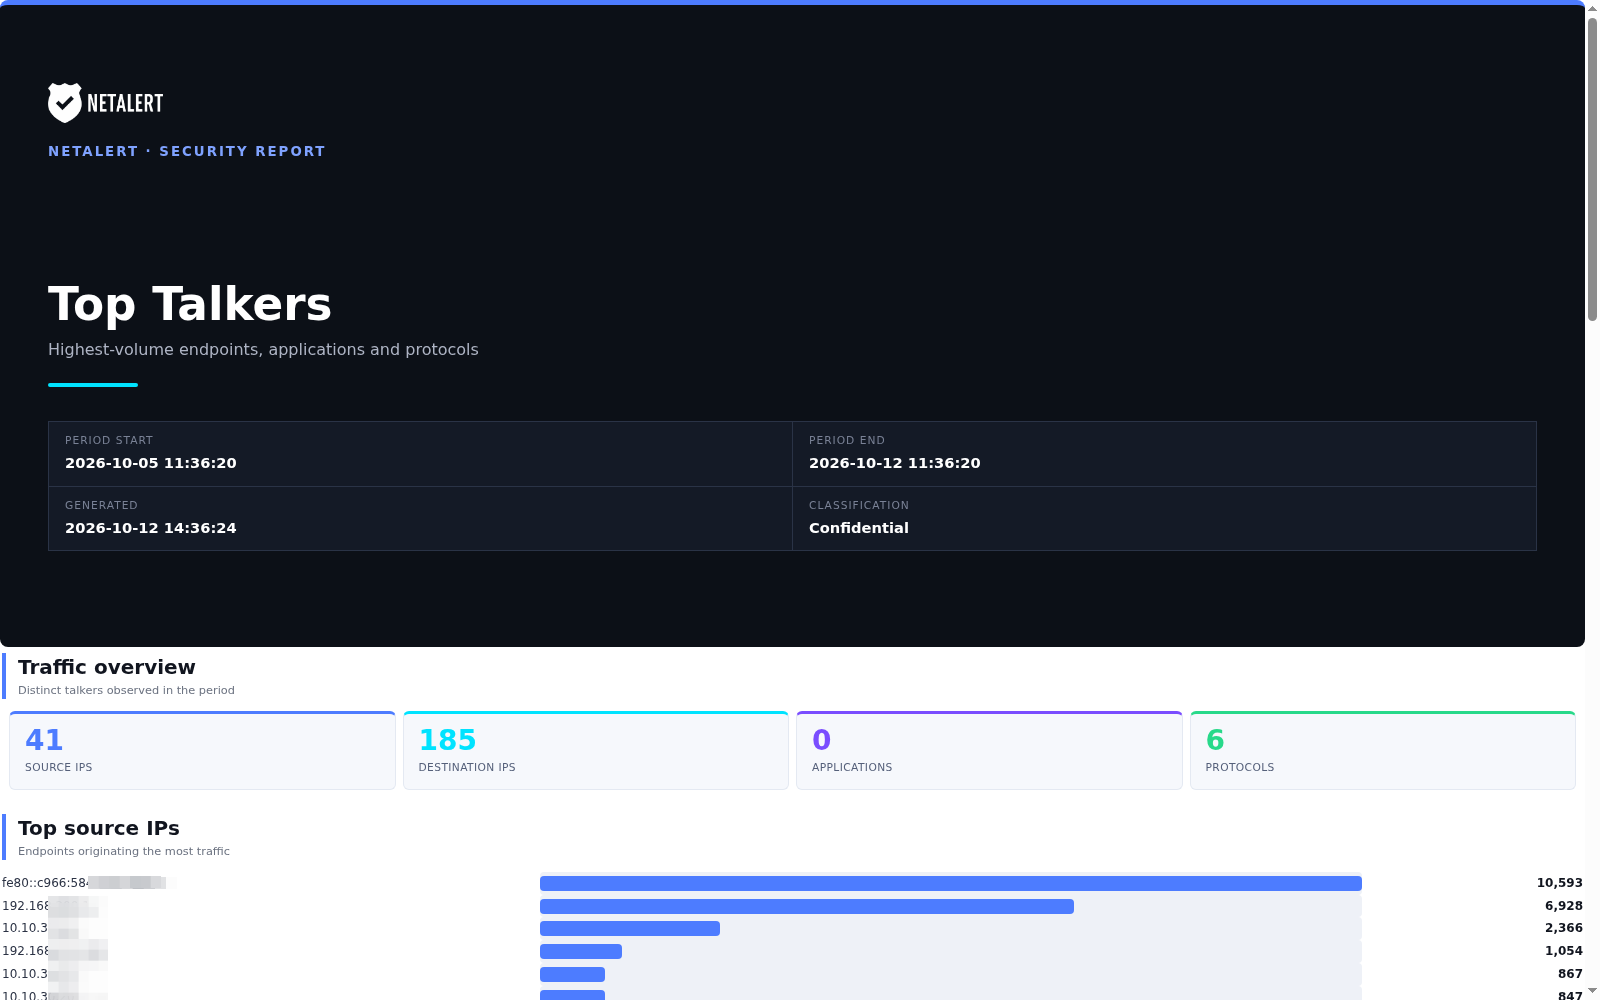
The HTML copy contains the same report, for viewing in a browser:
Reports configuration
NETALERT can generate reports automatically. Click Reports Config to open the settings for scheduled report generation.

Scheduled runs produce a Daily Statistics report covering the 24 hours before the run. Use the toggles to choose which sections it contains:
- Alert Name - alerts grouped by type.
- Alerts Count - the number of alerts over the period.
- Destination IP Count - the top destination IP addresses.
- Destination Port Count - the top destination ports.
- Detected Traffic Tag - the classification tags assigned to the traffic.
- DNS Request Error - failed DNS requests.
- Emails - the top email addresses seen in traffic.
- Ethernet TypeCount - the Ethernet frame types observed.
- Hostnames - the top hostnames.
- ML Score - the machine learning scores over the period.
- Protocol Count - the protocol distribution.
- Source IP Count - the top source IP addresses.
- Source Port Count - the top source ports.
- Traffic Count - the volume of traffic over the period.
Reports Interval sets how often the scheduled report runs: Hourly, Daily, Weekly or Monthly. Click its edit button to open the Edit Reports Interval window, pick a value and click Save.

Reports generated by hand from the Generate a Report form are not affected by these settings.
Go back to the Administration index.