Documentation
ML Health
ML Health
A machine-learning detector can fail quietly. It continues to run, produces no error, and simply stops being useful - because its training failed, or because the traffic has drifted away from what it learned. ML Health exists to make that visible, by reporting what each ML detector is actually doing rather than only whether it is enabled.
Navigate to Administration > Detection & Alerts > ML Health.
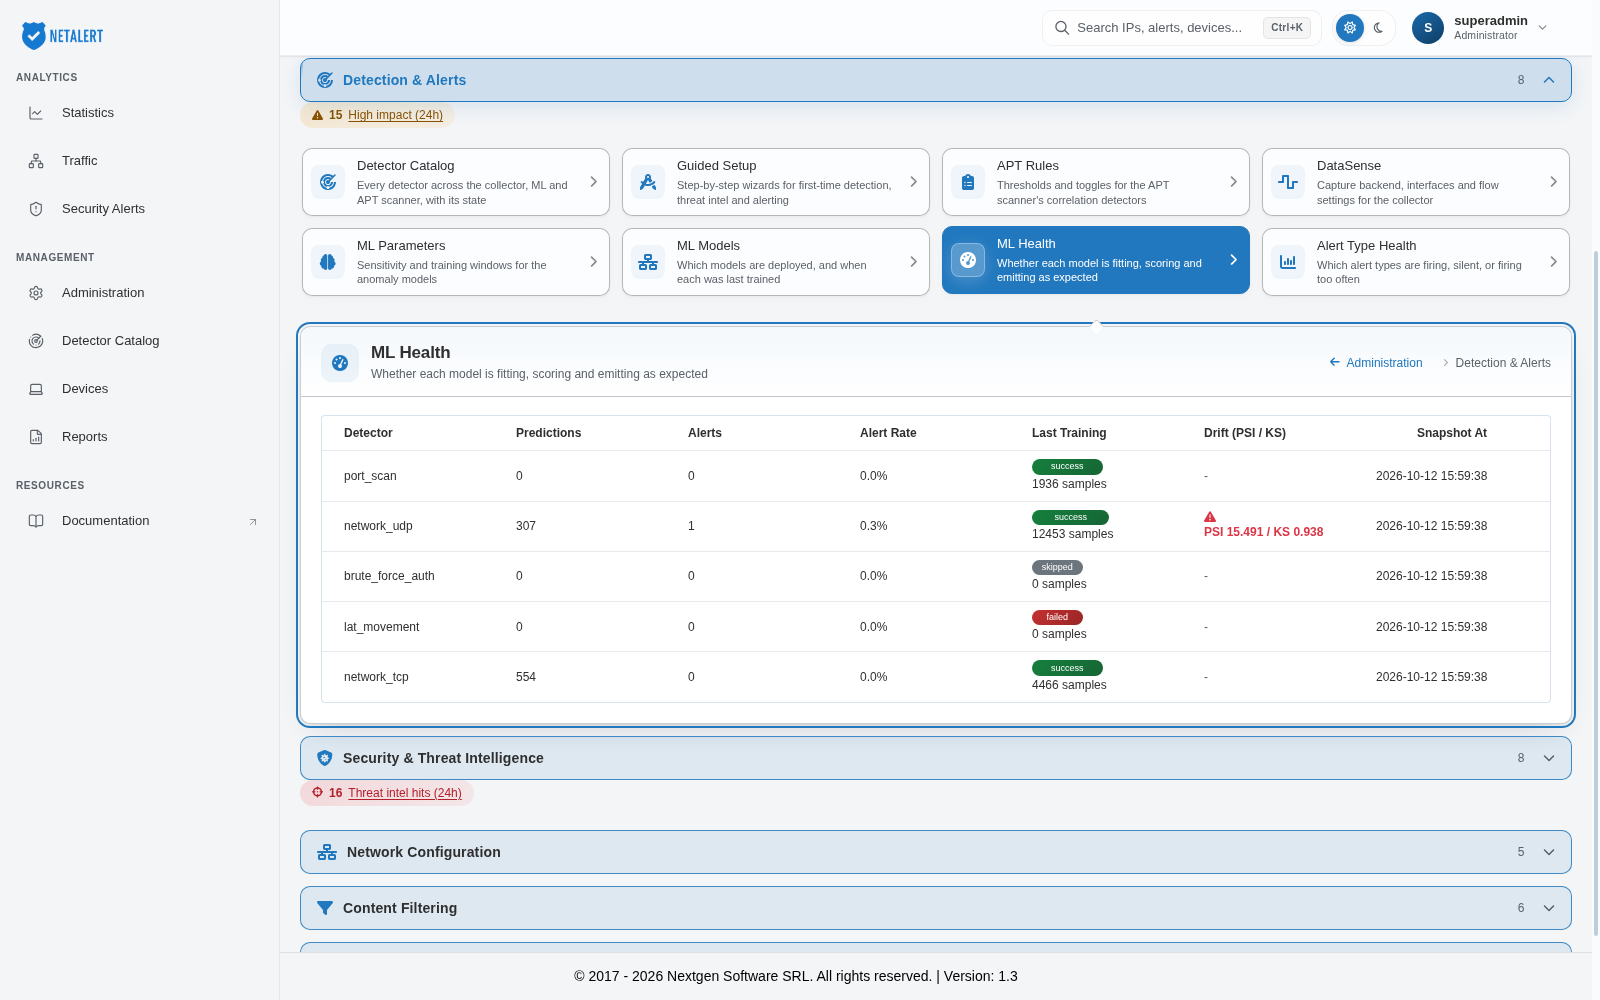
Reading the table
| Detector | The ML detector the row describes |
| Predictions | How many records the detector scored in the period |
| Alerts | How many of those scores resulted in an alert |
| Alert Rate | Alerts as a percentage of predictions |
| Last Training | Outcome of the most recent training attempt - success, failed or skipped - with the number of samples used. No training recorded means no attempt has been logged yet |
| Drift (PSI / KS) | Statistical measures of how far current traffic has moved from the traffic the model was trained on |
| Snapshot At | When these figures were recorded |
Interpreting alert rate
Alert Rate is the most informative column, and both extremes are a problem.
A rate at or near 100% means the detector alerts on essentially everything it scores. Such a detector is not discriminating between normal and abnormal - it is labelling all traffic anomalous - so its alerts carry no information even though the alert count looks impressive. This usually means the model was trained on unrepresentative data, or a threshold is set far too low.
A rate of 0% across a long period means the opposite: the detector is scoring traffic but never finding anything unusual. That may be correct on a quiet network, but combined with a failed training result it more likely means the detector has no usable model.
A healthy detector sits well between the two, alerting on a small fraction of what it sees.
Interpreting last training
failed with 0 samples is the clearest fault this page reports: the detector had no data to learn from, so no model was produced and the detector cannot meaningfully score anything. Common causes are a detector enabled on traffic the appliance does not see, or a training window that captured no qualifying activity.
skipped with 0 samples means the training run found no usable data and did not attempt to build a model. It is not an error in itself, but the detector keeps its previous model (or has none) until a run finds enough qualifying traffic.
A success result with a very small sample count is a weaker version of the same problem - the model exists but has thin evidence behind it.
Interpreting drift
Drift compares the distribution of current traffic against the distribution the model was trained on, using the Population Stability Index (PSI) and the Kolmogorov–Smirnov (KS) statistic. Rising drift means the network has changed - new systems, changed working patterns, a new application - and the model’s notion of normal is increasingly out of date. Sustained high drift is a signal to retrain, not necessarily a sign of an attack.
The page flags the drift value with a warning icon when PSI reaches 0.1 (shown in amber) and shows it in red from 0.25, the level conventionally treated as a significant shift.
A dash indicates drift has not been computed, which is expected where there is no baseline model to compare against.
Acting on what this page shows
- Training failed - check that the detector is scoped to traffic the appliance actually receives, then review the training parameters on ML Parameters.
- Alert Rate near 100% - the detector is contributing noise. Adjust its threshold, or disable it until it can be retrained on representative data.
- High drift - schedule retraining so the baseline reflects how the network behaves now.
- Model history - ML Models shows the versions and sample counts behind each detector.