
Documentation
Finding Machine-Learning Anomaly Alerts
How to find the alerts raised by each anomaly-detection model in the Alerts page.
The anomaly-detection service (data-scoring) writes the alerts of its machine-learning models into the same alert index as the correlation alerts, in the same document structure. They appear in Alerts next to every other alert. This page shows how to isolate them, and how to tell the models apart.
Turn it on and create detectors
Everything is managed in Settings → Application → ML Anomaly Detection (permission Modify Settings). Four items at the top switch the page: Settings, Detectors, Models and How to use, which repeats the steps below in short form. The module is off by default; Detectors and Models appear after it is enabled.
1. Turn it on
The service (data-scoring) is a container of the CyberQuest stack that is not started by default. On the server, set DATA_SCORING_OPENSEARCH_PASSWORD (the OpenSearch cq password) in the stack’s .env, then start it:
docker compose --profile ml up -d data-scoring
In the page, switch on Enable ML anomaly detection and press Save. The badge shows Running once the service answers. Then switch on Run anomaly detectors and Create alerts from detectors and save again; the service applies changes within a minute. The numbers below the switches are optional: leave one empty to use the service default. Test connection asks the service to check its own connections to the database and to OpenSearch.
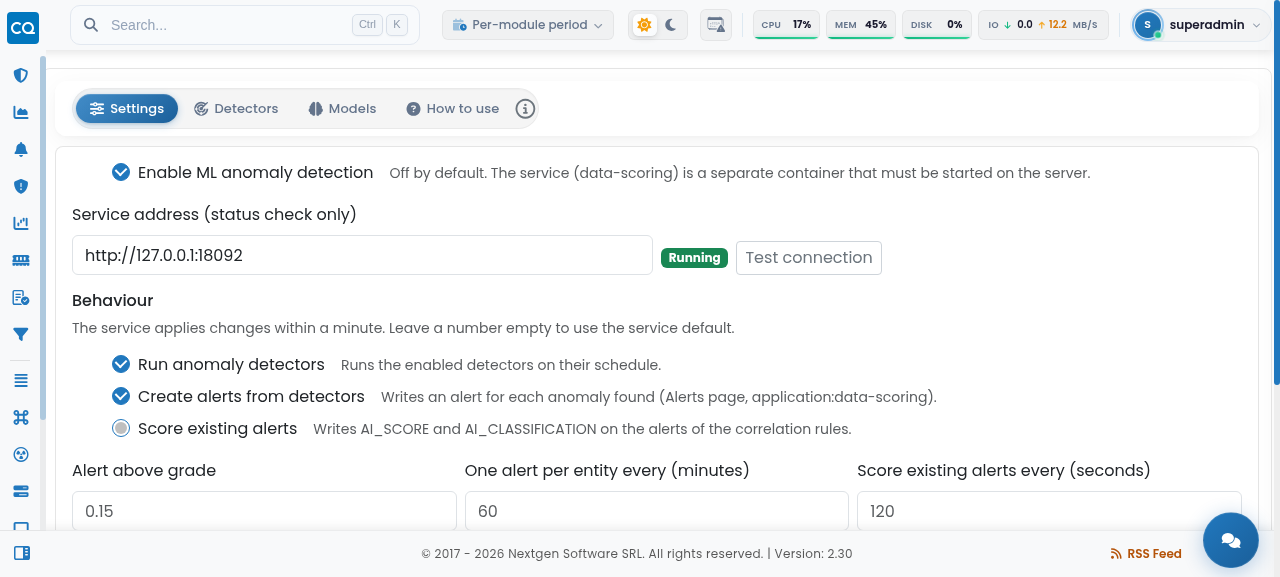
The service can also run on another VM, as long as it reaches the stack’s MariaDB and OpenSearch. In that case set Service address to where the web application can reach it; the address is only used for the status badge.
2. Create and run detectors
A detector is one saved anomaly-detection job: what to watch, which algorithm judges it and how often it runs.
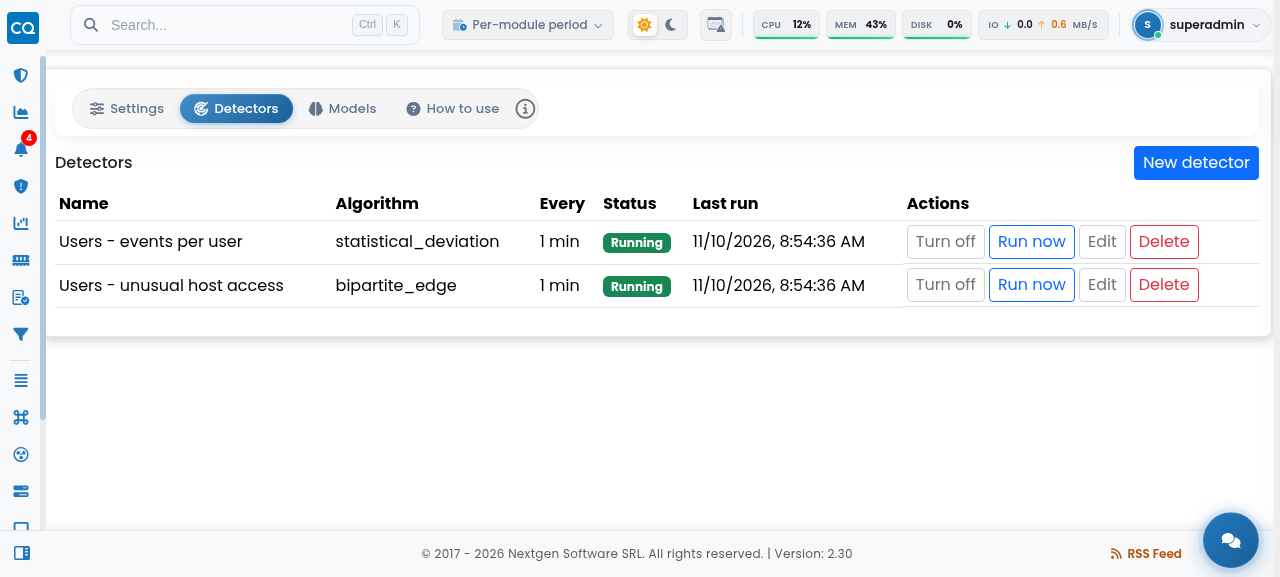
- New detector opens the form: name, algorithm, tenant, indices, time field, how often to run, the entity to watch (for example
UserName.exact) and the numbers to measure.bipartite_edgealso asks for the field the entity is compared with (for exampleComputer.exact) and measures no numbers. - Turn on makes the detector run on its schedule; Turn off pauses it. Run now runs it once; the request is picked up within 15 seconds.
- The Status column says Waiting for the service until the service has looked at the detector, Learning while there is too little history, Running once it scores each interval, and Failed with the reason when something is wrong (for example an invalid setting).
- Edit and Delete are always available. Saving an edit retrains the detector. Delete removes the detector with its trained model and state; alerts it already raised stay in Alerts.
3. See what was learned
The Models tab lists, for each detector, when its model was trained, from how many data points and for how many entities. A model is rebuilt automatically every day, and Retrain rebuilds it now. A detector needs at least 100 training points (100 distinct edges for bipartite_edge) before it can raise alerts.
Once a detector has run, its alerts appear in Alerts, as described below.
What identifies an ML alert
Besides the usual alert fields, an ML alert carries:
| Field | Value | Use it to |
|---|---|---|
application | data-scoring | separate ML alerts from correlation alerts |
_anomalyData.ModelID | the algorithm: statistical_deviation, gaussian, elliptic_envelope or bipartite_edge | filter by model |
AlertName | Anomaly - <detector name> | filter by detector |
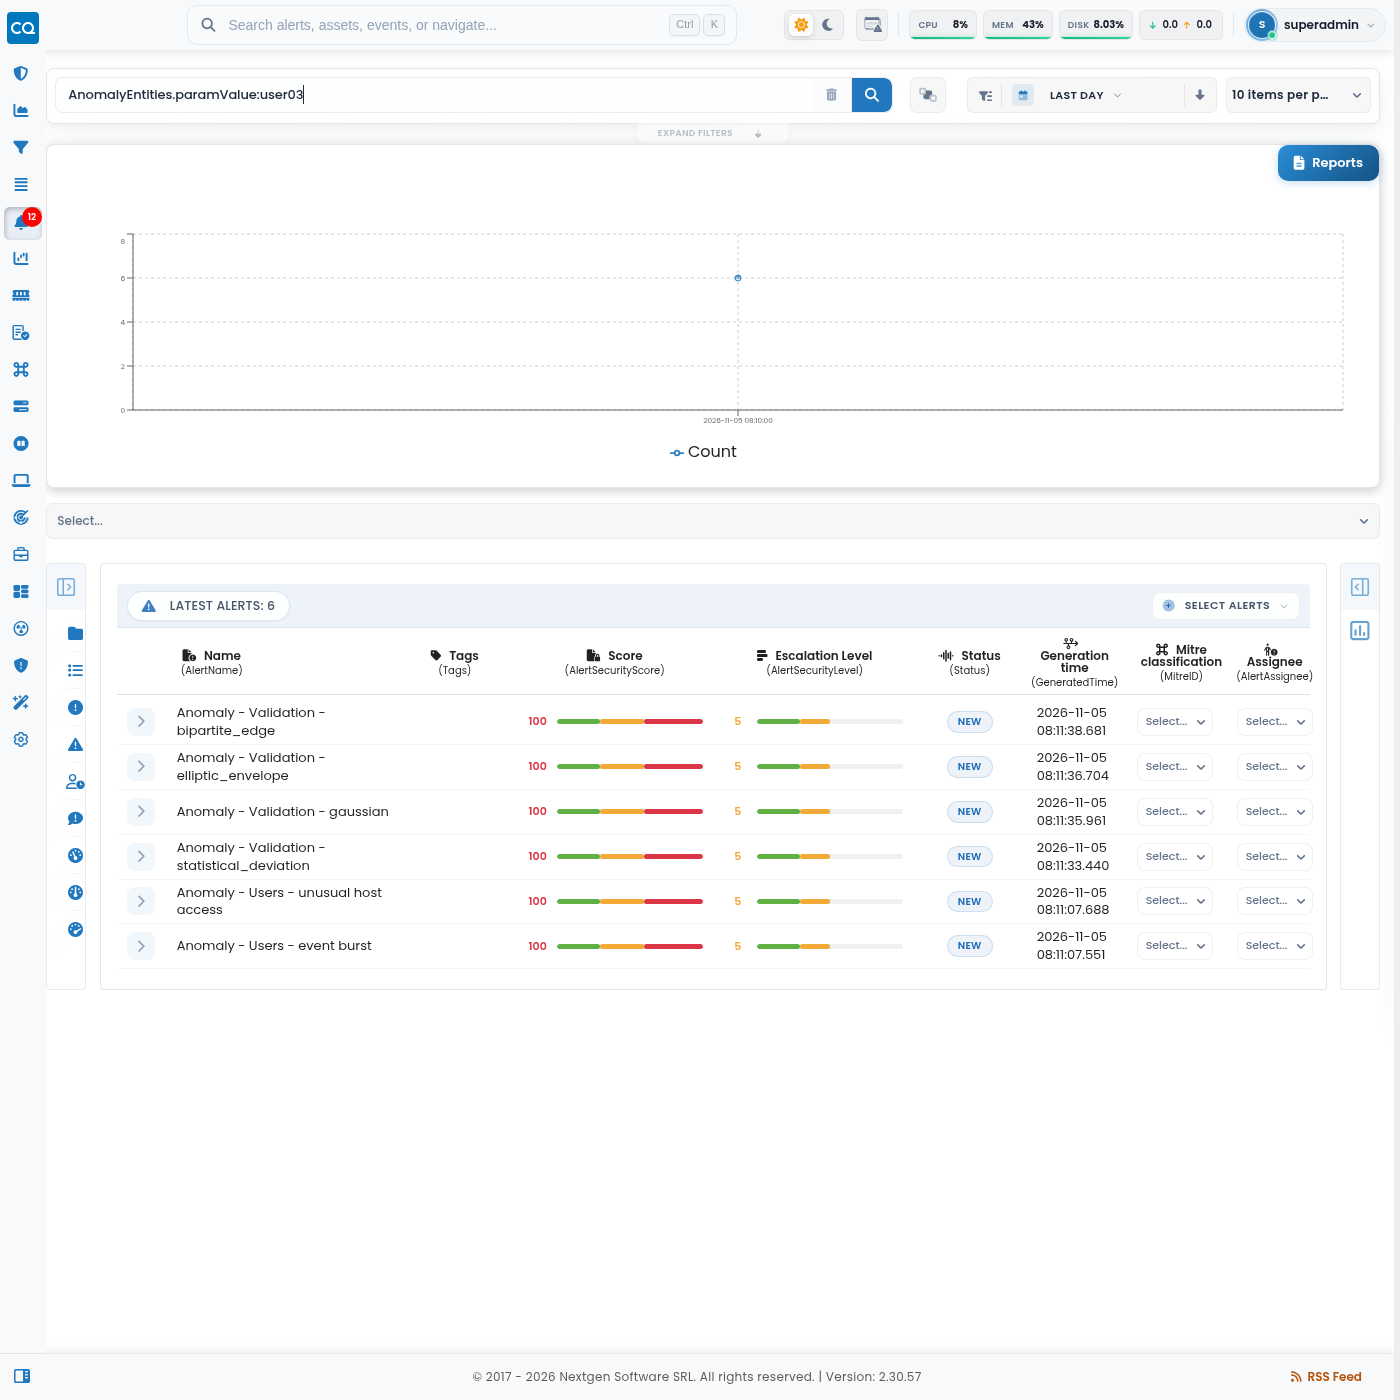
AnomalyEntities.paramValue | the flagged entity, for example a user name | filter by entity |
ML alerts have no Users or Computers fields, so the User and Host filter boxes do not find them. Search by entity as shown below.
Before you search
- Open Alerts.
- Set the time range. The page opens on Last Hour, which shows No results for alerts generated earlier. Choose Last day or longer.
- Type the query in the search box and press Enter.
Plain text matches the alert name and the Why text. A query that contains :, parentheses or AND / OR / NOT is treated as a field query.
One query per model
Statistical deviation
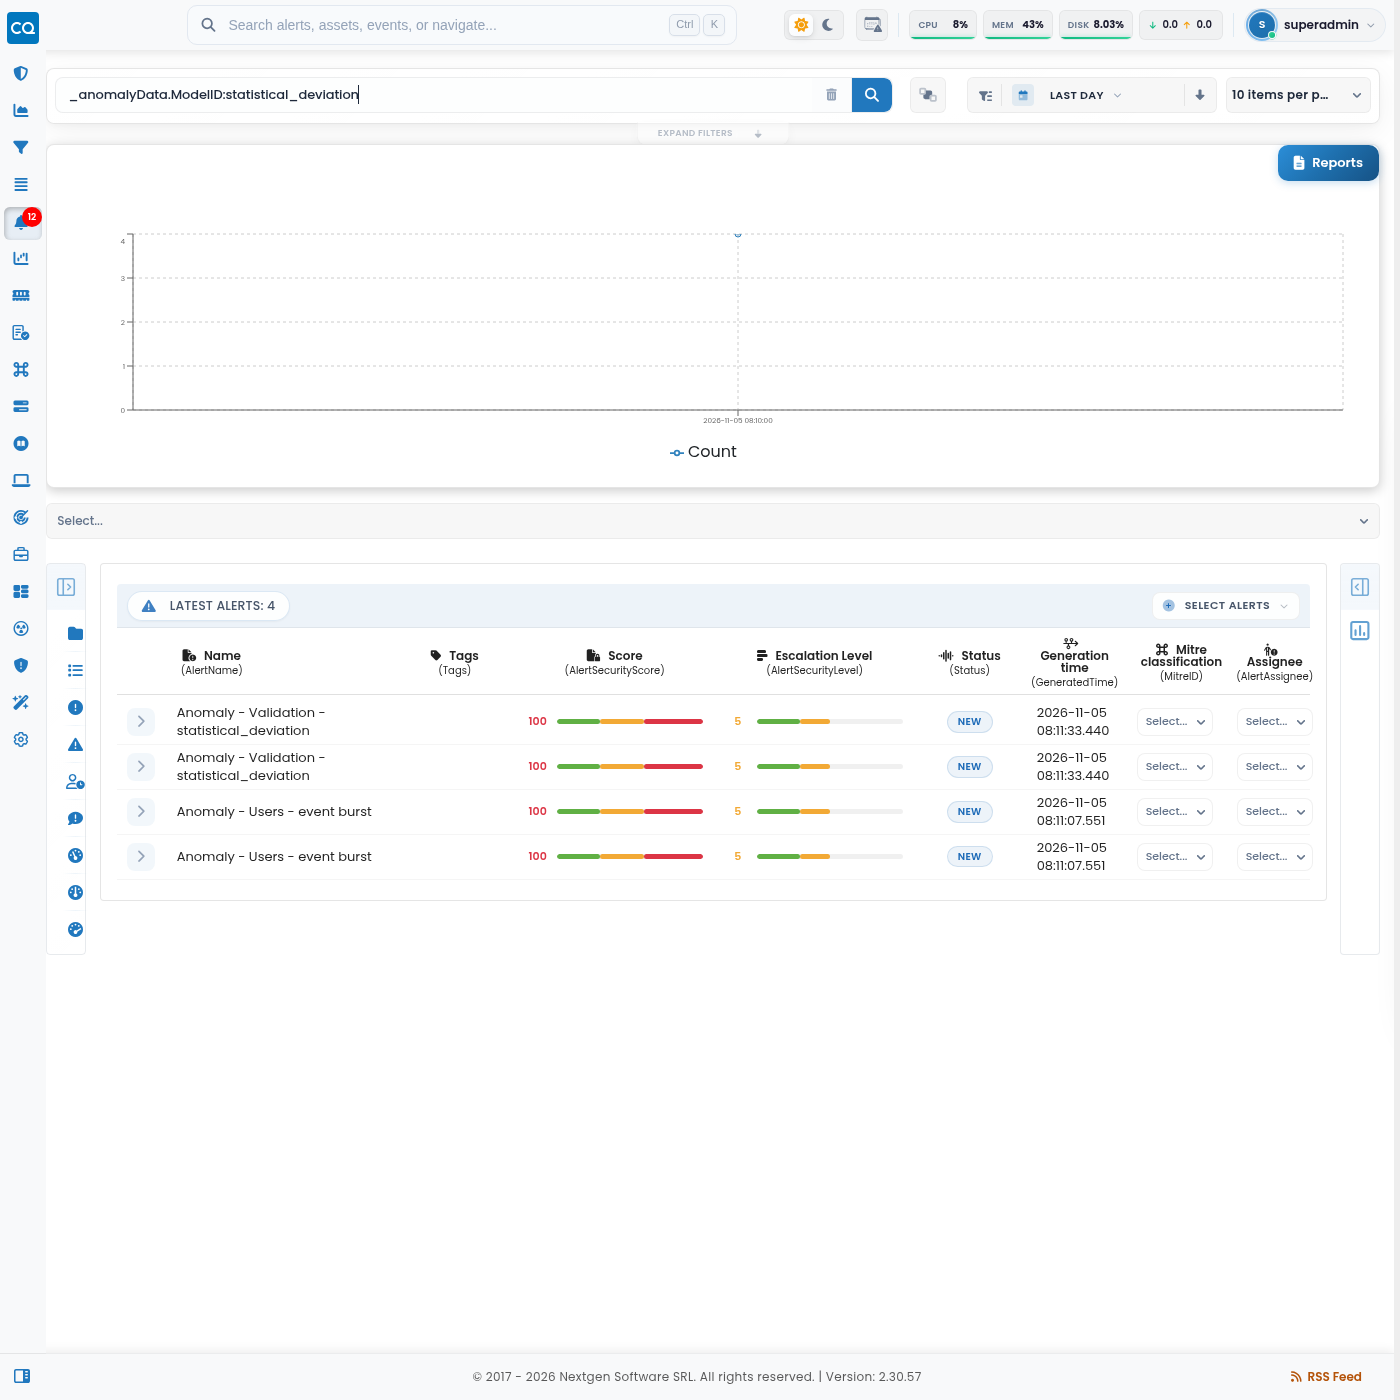
_anomalyData.ModelID:statistical_deviation
Gaussian
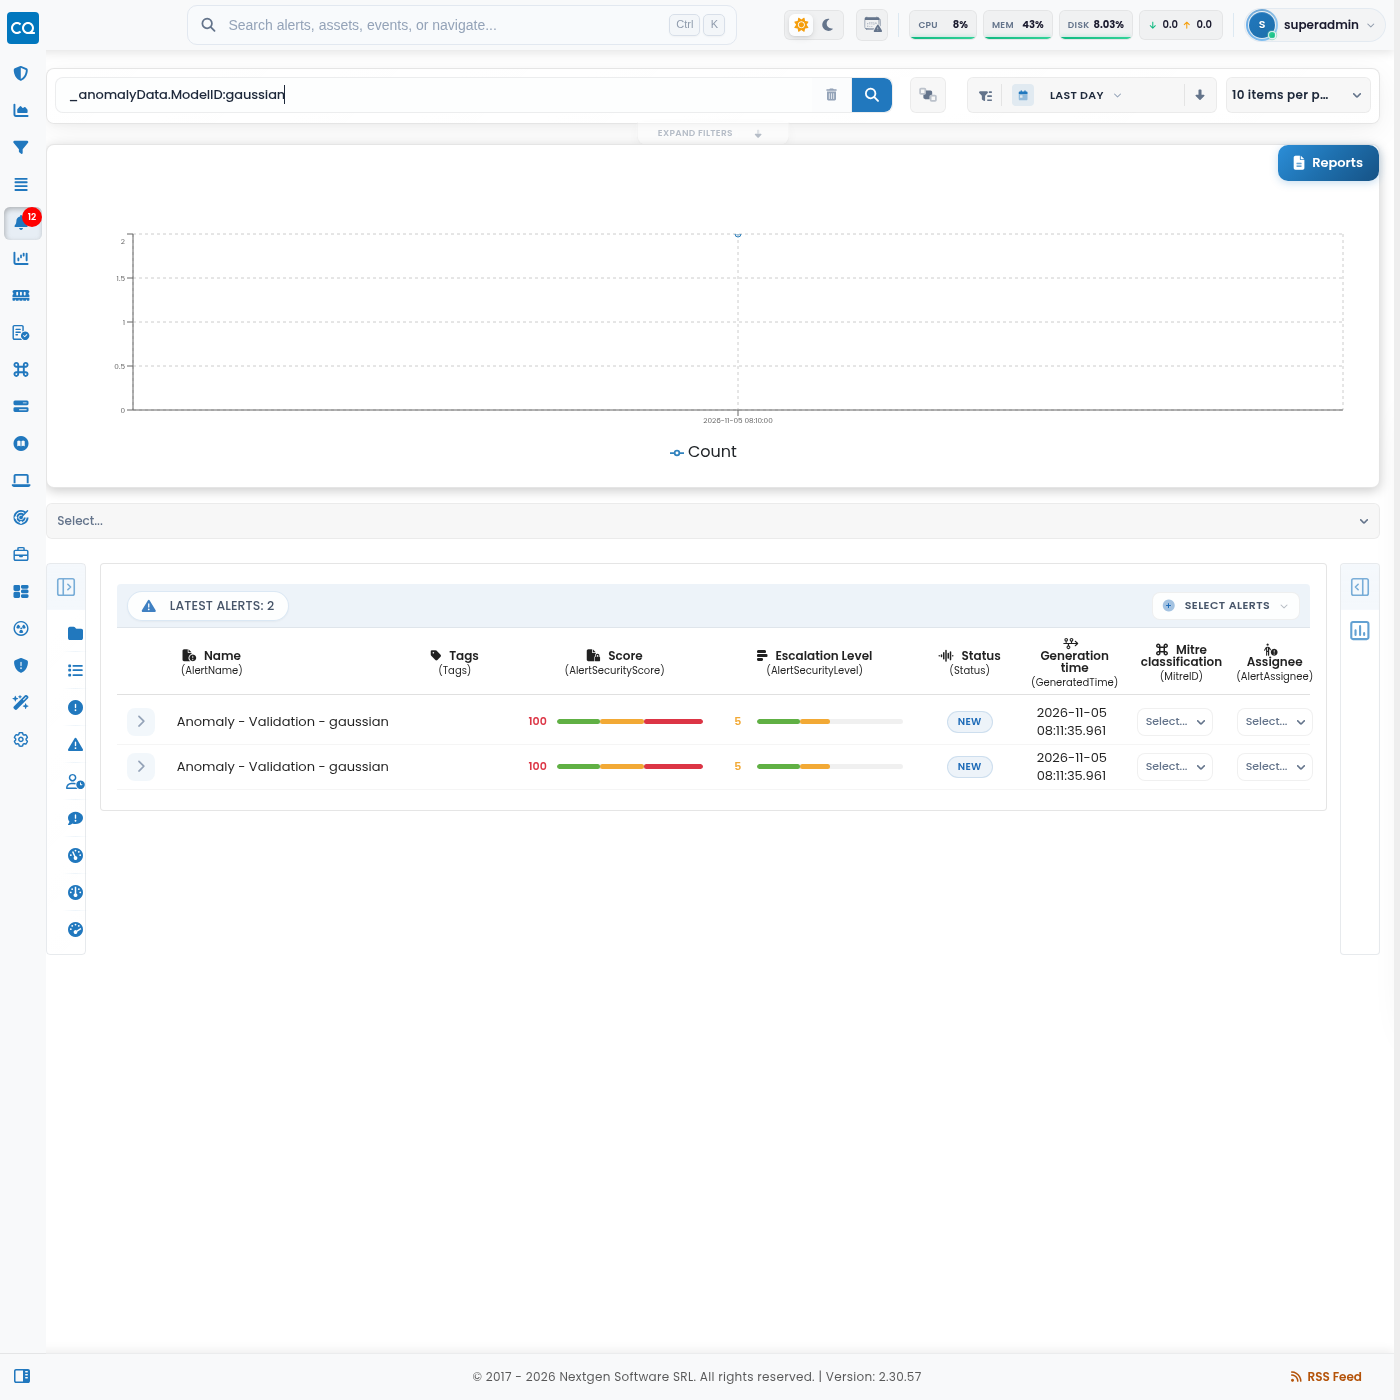
_anomalyData.ModelID:gaussian
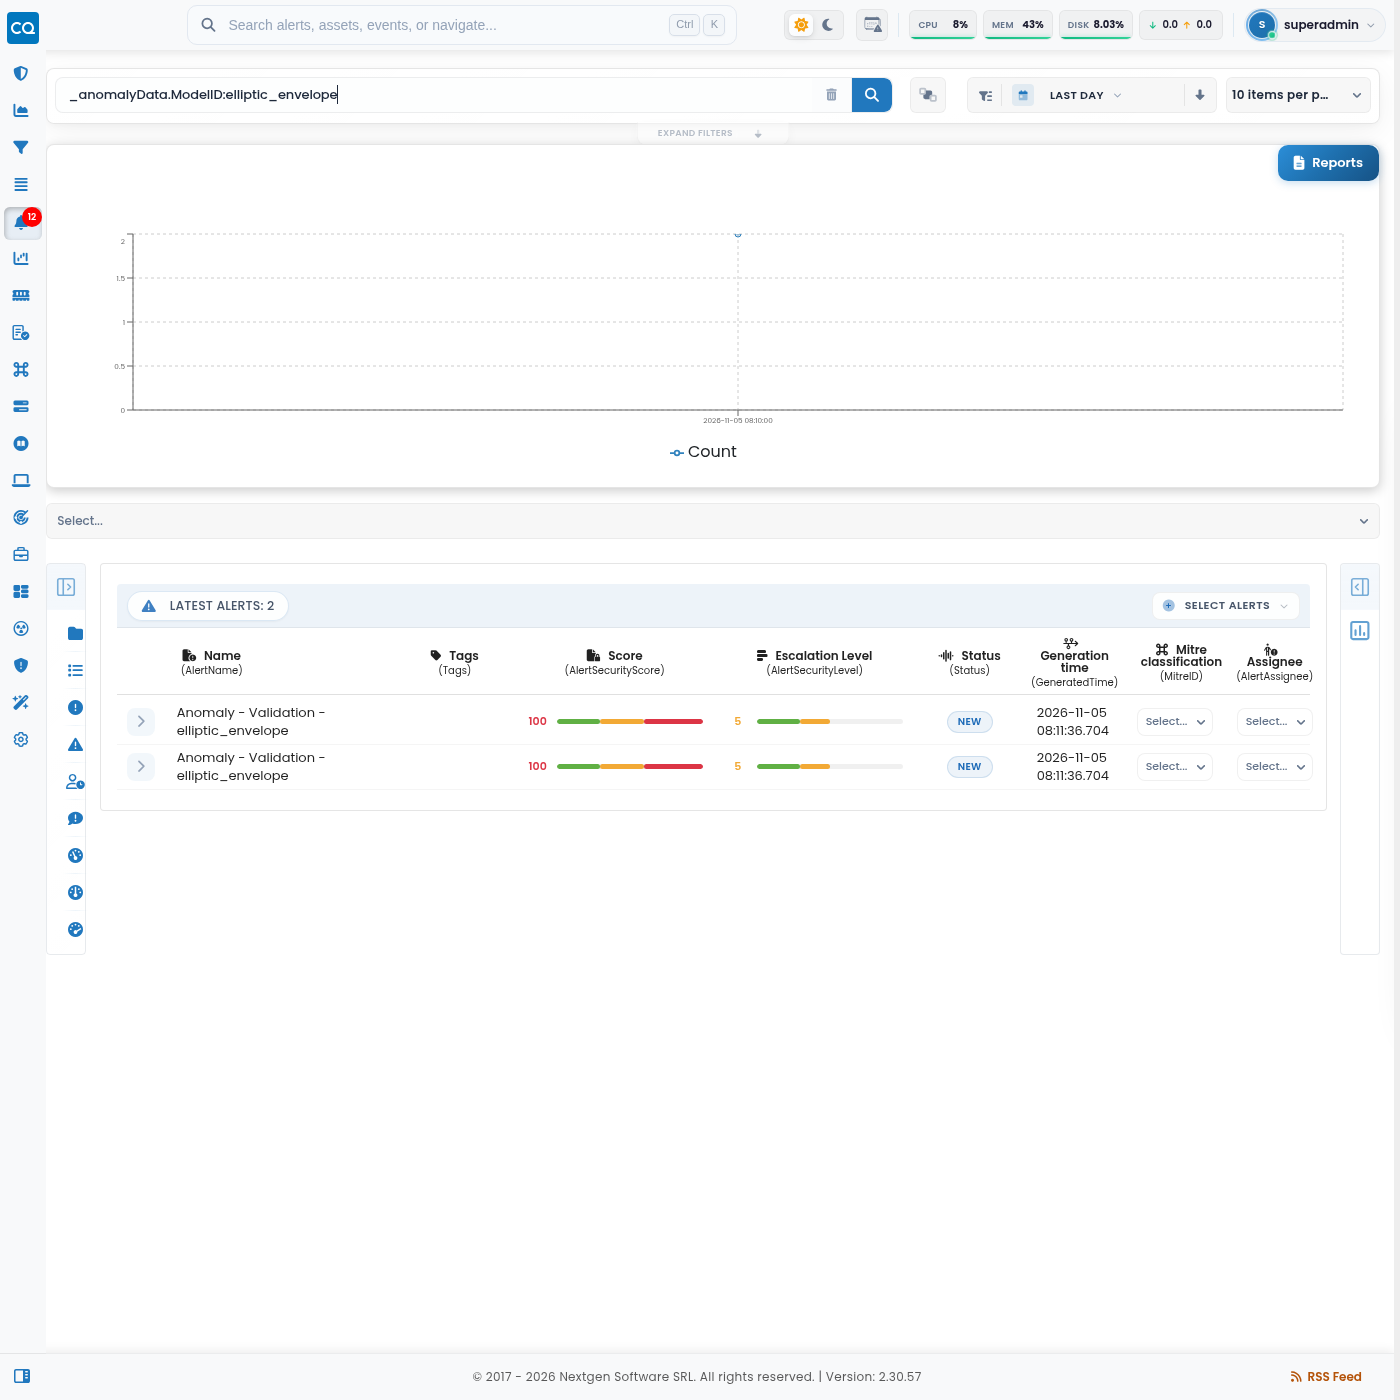
Elliptic envelope
_anomalyData.ModelID:elliptic_envelope
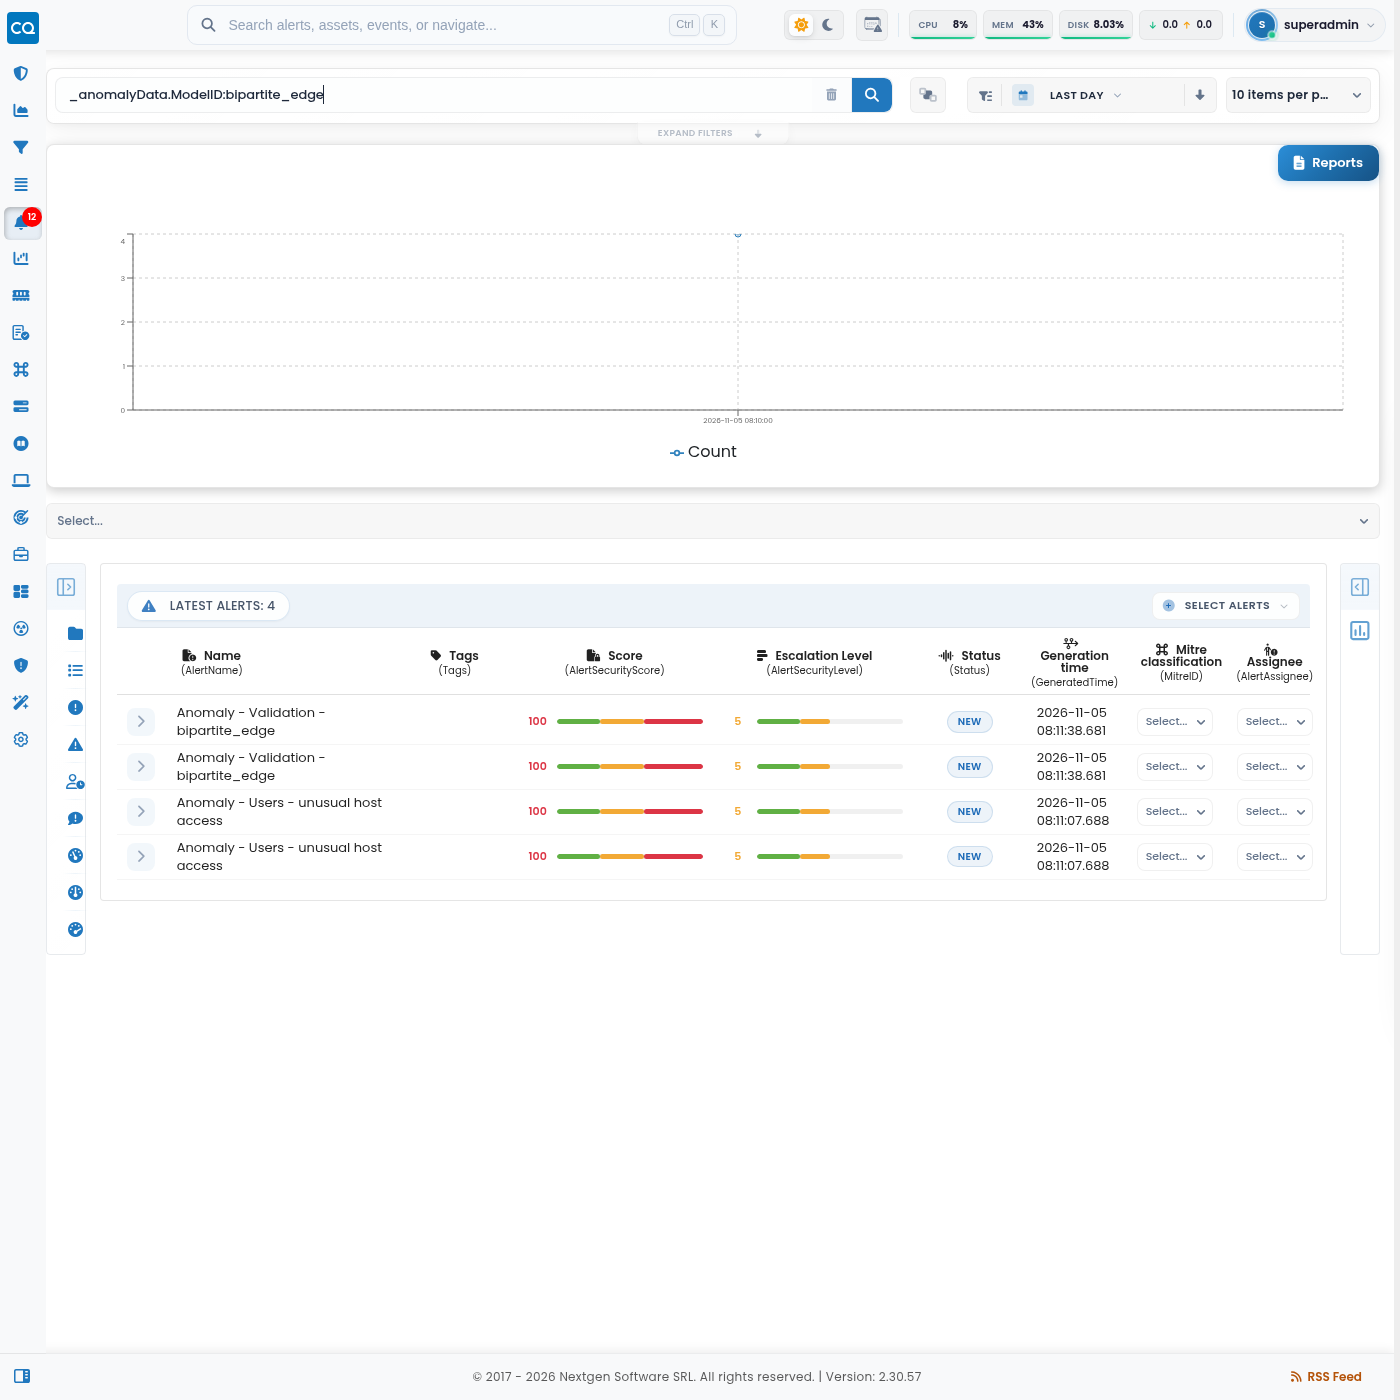
Bipartite edge
_anomalyData.ModelID:bipartite_edge
Combining filters
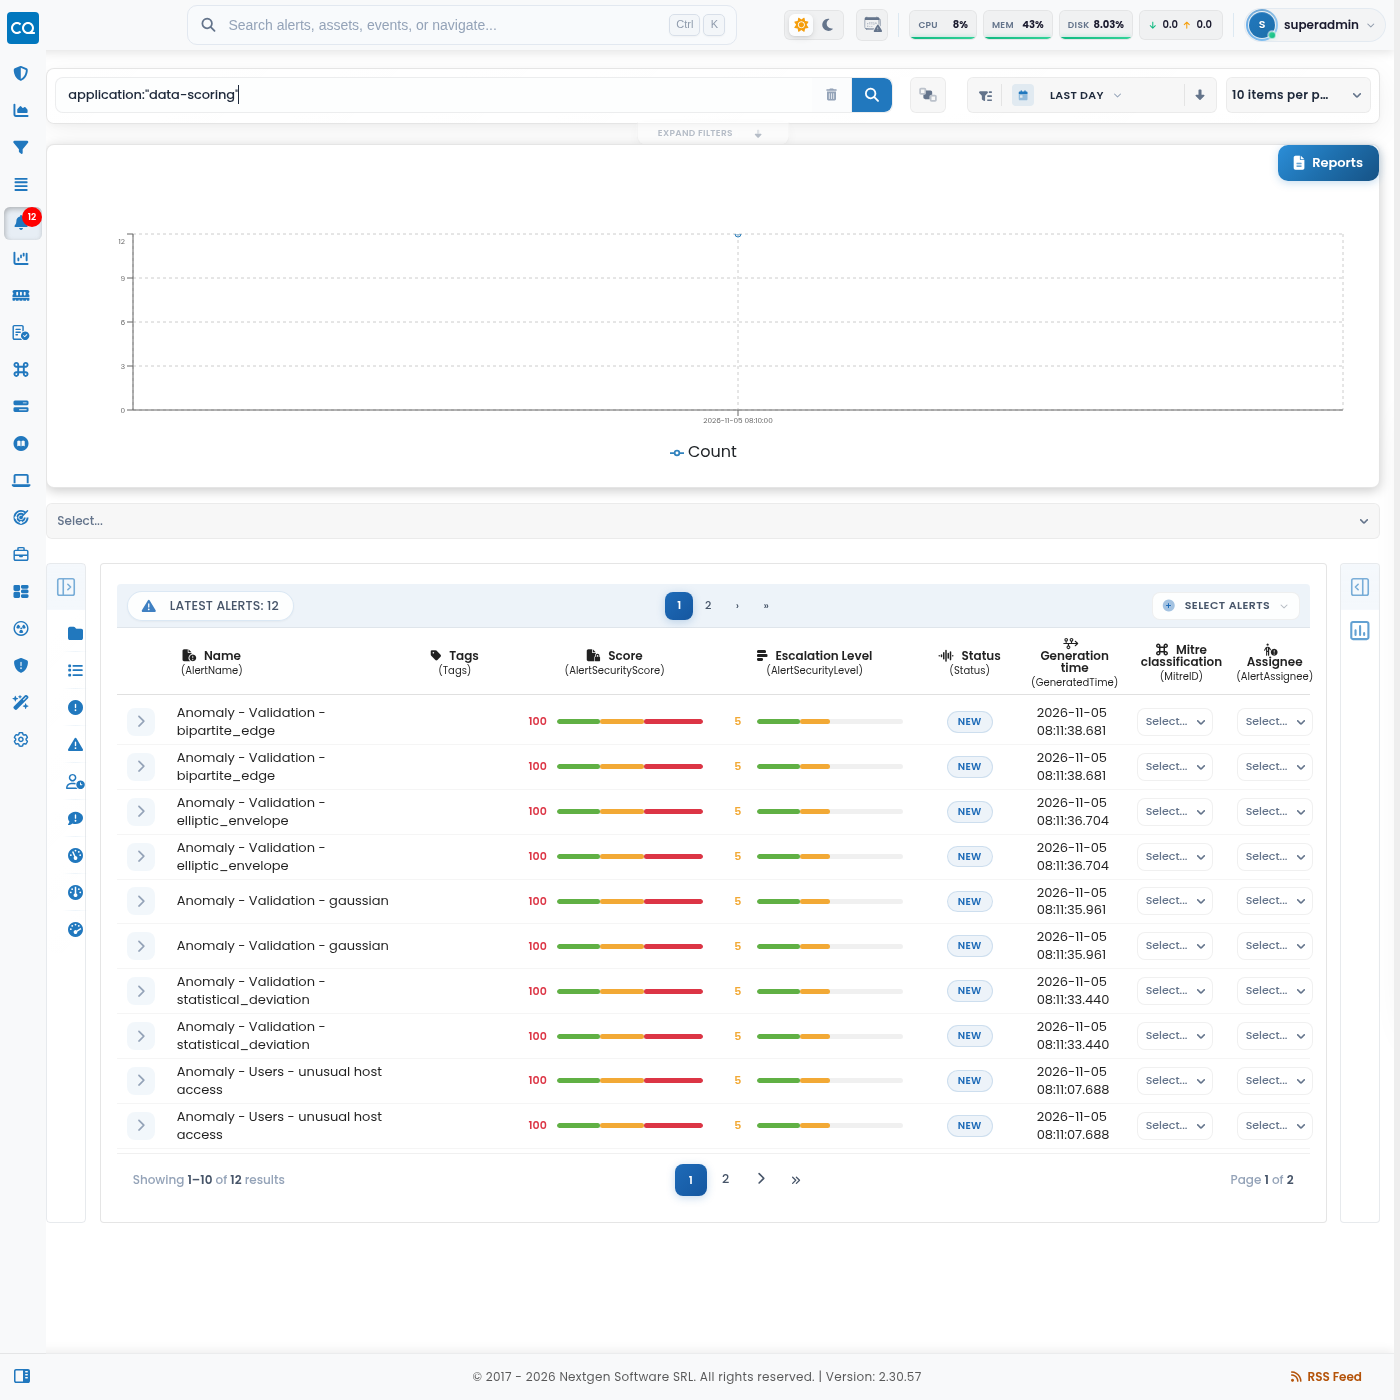
All ML alerts
application:"data-scoring"
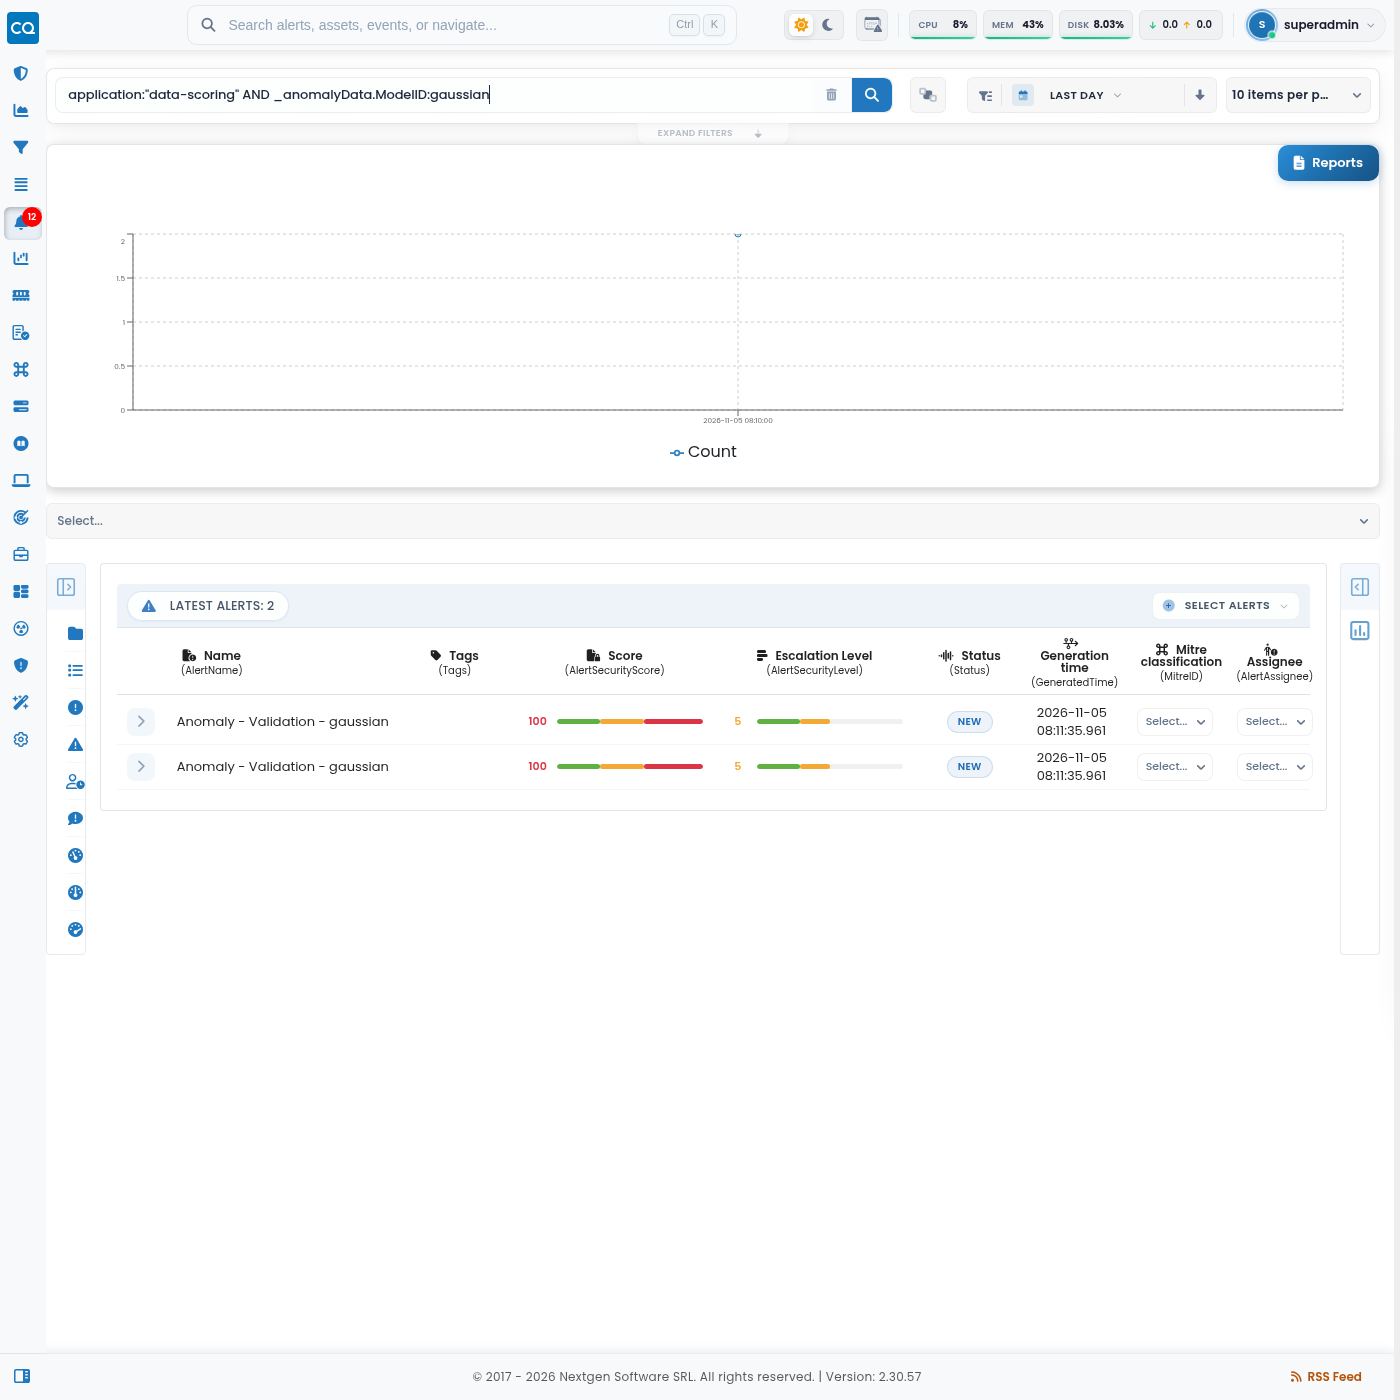
One model, ML alerts only
application:"data-scoring" AND _anomalyData.ModelID:gaussian
One detector
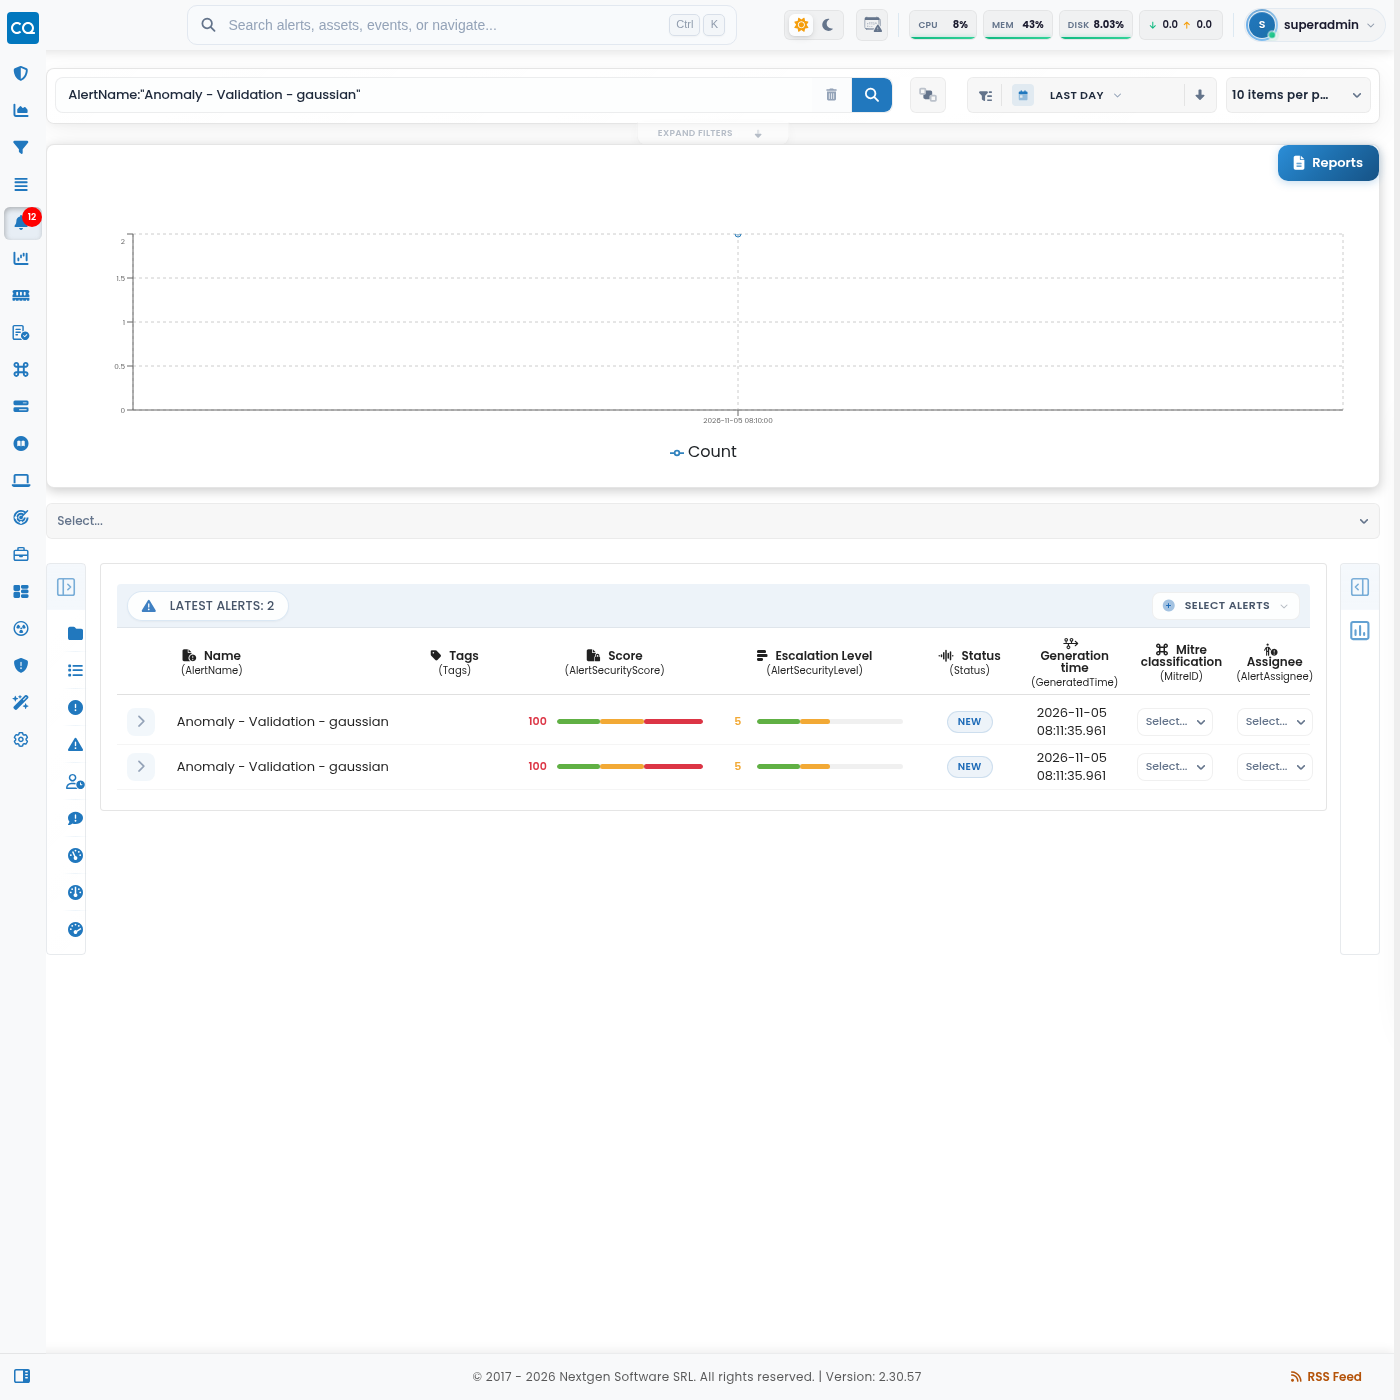
Quote the whole alert name:
AlertName:"Anomaly - Validation - gaussian"
One entity
AnomalyEntities.paramValue:user03
Model and entity
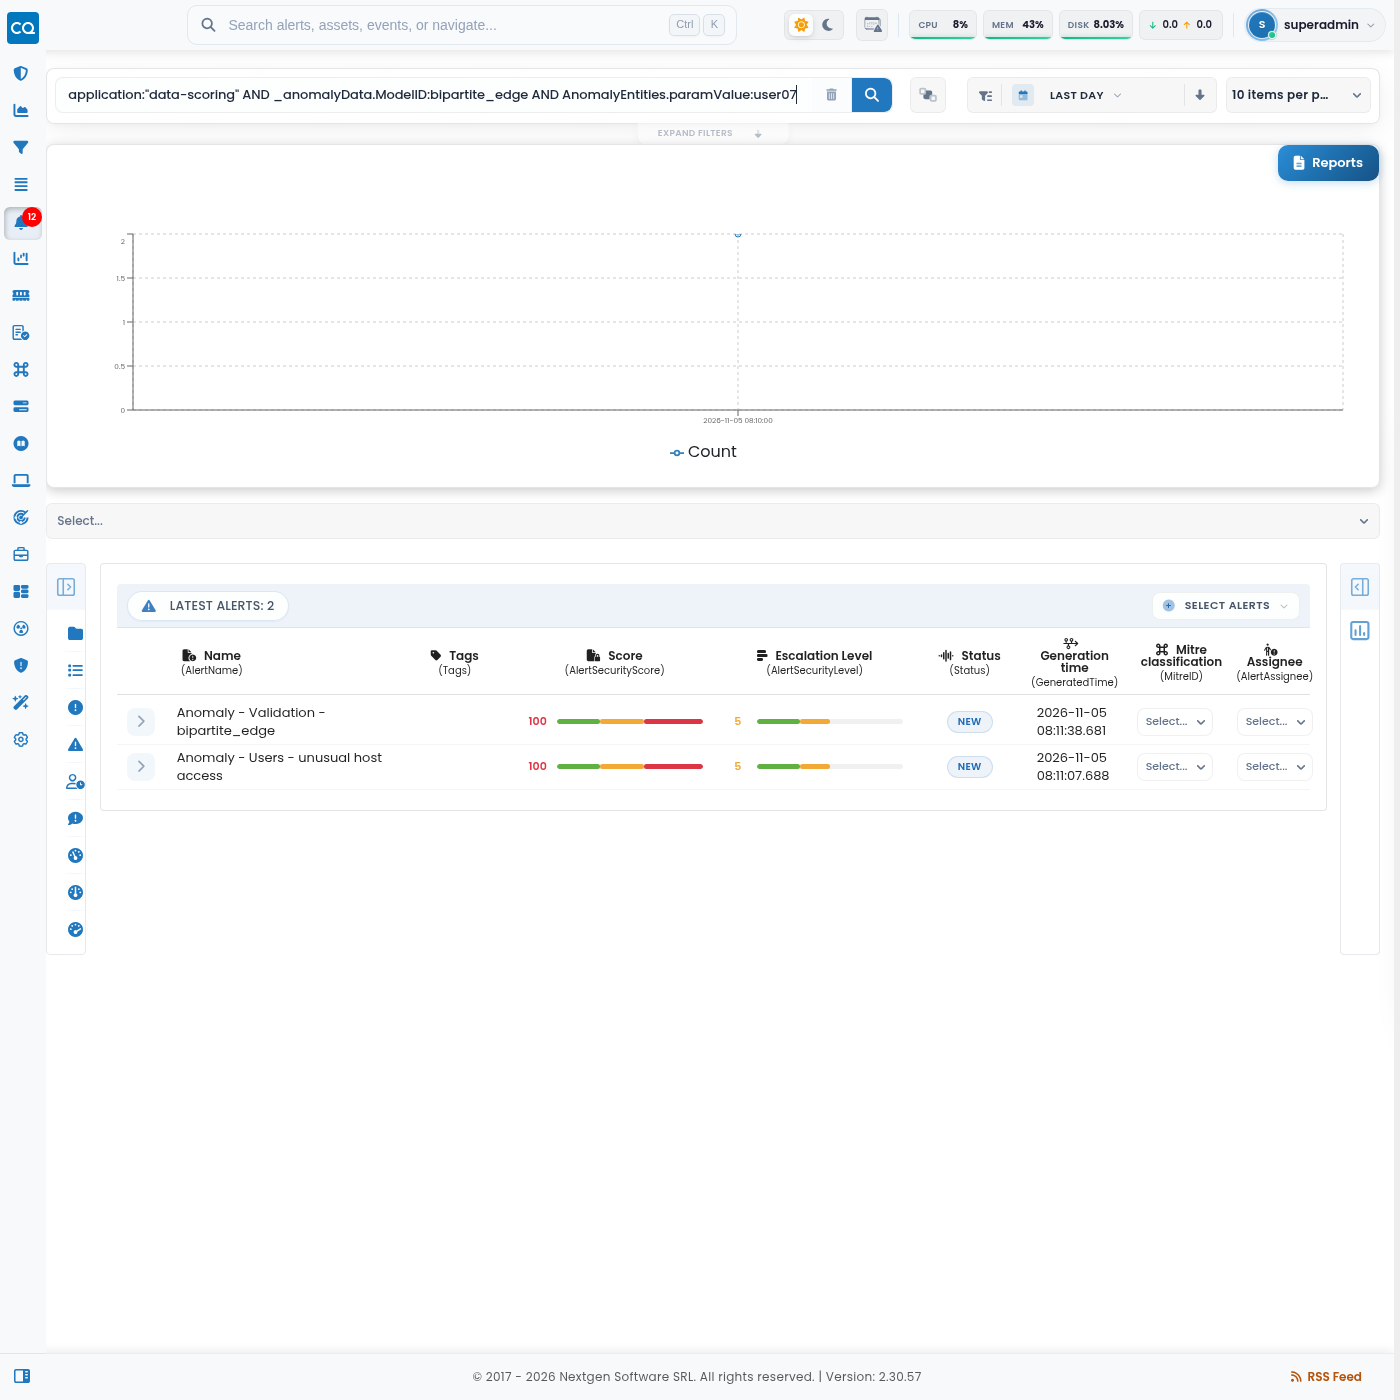
application:"data-scoring" AND _anomalyData.ModelID:bipartite_edge AND AnomalyEntities.paramValue:user07
Things to know
- Do not use plain text with
-in it.Anomaly - Validationmatches every ML alert, not only the ones you typed. UseAlertName:"..."with the full name. - The Why text is not searchable with a field query (
Why:hostsreturns nothing). Search by model, detector or entity instead. - A detector’s name does not say which model it uses.
_anomalyData.ModelIDis the reliable way to filter by model. - ML alerts have a score from 0 to 100 and escalation level 5. They have no AI score or AI classification; those apply to correlation alerts only.